The outpatient department (OPD), a vital component of a hospital’s operations, provides accessible and cost-effective care to a substantial patient cohort. Patient satisfaction with OPD services is pivotal in optimising a hospital’s overall performance. Further, OPD acts as a crucial triage point, with 8-10 percent of patients requiring subsequent in-patient care. An efficient OPD mitigates patient dissatisfaction, streamlines the admission process, and facilitates navigability within the healthcare system.
Recent research studies also highlighted the need to reduce lengthy waiting times, identified by the WHO as a key indicator of healthcare quality and satisfaction, to improve patient satisfaction, trust, and willingness to access healthcare services.
Need of the study:
Timely diagnosis and treatment significantly improve patient survival and quality of life. Delays in consultation and treatment initiation can lead to poor outcomes. To this end, intervention studies through information, communication, surveys, and education are crucial. Researches found that patients are willing to wait 30-45 minutes to see a doctor, but waiting times in some hospitals exceed 1-2 hours. Patient satisfaction is influenced by factors like waiting area conditions, entertainment options, and staff friendliness.
At AIIMS Patna, patients from rural Bihar face challenges navigating the facility. To reduce overcrowding and time wastage, this study aims to measure the total duration spent by patients from registration to consultation and identify factors causing delays.
Objectives
The study was set out with following objectives.
1. To determine the average time spent by the patients at selected OPDs at AIIMS Patna.
2. To find out the association between the selected demographic variables with average time spent by the patients.
3. To identify the factors influencing the patient’s waiting time.
4. To find a correlation between waiting time and patient satisfaction level.
Review of Literature
A cross-sectional study was conducted by Joshi et al (2023) at the Cancer Research Institute of Himalayan Hospital to estimate waiting time and consultation duration for radiation oncology outpatients. The study’s objective was to assess the quality of radiation oncology OPD services, as waiting time greatly impacts patient satisfaction, serving as a crucial indicator of hospital care quality; 300 patients were randomly selected, and data was collected through direct observation. The study found that 60.6 percent patients aged 50-69, 85 percent follow-ups, and 66.7 percent arrived between 8:30 am and 10:30 am. The mean waiting time was 50.43 minutes (84.1% of total time), and consultation time was 9.53 minutes (15.9%). Delays were mainly due to consultants’ unavailability.
Saxena et al (2020) conducted a study on outpatient department waiting times in the Armed Forces Tertiary Hospital, a Northern Indian hospital, to assess services and suggest improvements. Among 100 randomly selected respondents, 62 percent were male, 76 percent married, 55 percent local, and 63 percent repeat patients. Results showed that 95 percent spent less than 30 minutes registering, while 49 percent waited over 30 minutes for consultation. Laboratory and radiodiagnosis waits exceeded 30 minutes for 12 percent and 29 percent, respectively. Key problem areas included overlapping rounds and OPD times, sample transportation, and radiology preparation. Implementing queuing methods, advanced simulations, and real-time waiting systems can enhance healthcare efficiency.
A prospective observational study conducted by Langstieh et al (2022) assessed patients’ waiting time in a neurology outpatient department in a tertiary healthcare institution in North-East India. Among 80 randomly enrolled participants, the mean waiting time was 110.86 minutes, the consultation time 5.34 minutes, and the total waiting time was 116.20 minutes. The findings highlight the need to reduce lengthy waiting times, identified by the WHO as a key indicator of healthcare quality and satisfaction, to improve patient satisfaction, trust, and willingness to access healthcare services.
Ogunlesi et al (1992) investigated waiting times at University College Hospital’s children’s emergency room, reporting a mean waiting time of 73.9 minutes (SD: 5.4 min), with night shifts experiencing longer delays.
Saeed Asefzadeh (1994) studied waiting times at Woods Children’s Teaching Hospital, Qazvin, Iran, and found that the average waiting time to see a paediatrician was 77 minutes, and the average visit length with a paediatrician was 3.4 minutes. The intern wait time was 7.8 minutes, and the visit length was 7.7 minutes (longer in morning/afternoon shifts). Dansky et al (1997) investigated the relationship between patient waiting times and satisfaction with ambulatory healthcare services. Key findings were that informing patients about waiting time and providing distractions during waiting time significantly improved patient satisfaction in ambulatory healthcare.
Jawahar (2004) conducted a study on outpatient satisfaction at Sree Chitra Tirunal Institute for Medical Sciences and Technology (STIMST), Thiruvananthapuram, to assess patient awareness of services, evaluate service performance and identify patient problems. The study highlighted that 90-95 percent of the 200 patients were satisfied with services, 70 percent waited more than 30 minutes, but some experienced prolonged waiting time (more than 3 hours). Ademola-Popola et al (2005) assessed patient-perceived quality of eye care in a Nigerian teaching hospital (n=124) and found that 89.4 percent of patients experienced long waiting times for eye care. Hospital workers’ strikes also caused missed clinic. In a cross-sectional study on the impact of adjustment measures on outpatient waiting times in Shanghai community hospital, Bai-lian et al (2006) found that total visit times were 43.6 minutes, 19.1 minutes and 34.3 minutes in the morning, afternoon and whole day respectively.
Anderson et al (2007) found that patient satisfaction with primary care is influenced by seven key domains (access, communication, provider personality/demeanour, quality of medical care processes, care continuity, healthcare facilities quality and office staff quality) with communication and follow-up care being crucial. Rizvi et al (2008) evaluated patient satisfaction at Civil Hospital’s surgical outpatient department, Karachi (n=490). The reported mean waiting time was 47.47 ± 15.29 minutes (range: 15-150), and the mean consultation time was 6.03 ± 3.34 minutes (range: 2-20). Ramjet (2009) assessed patient satisfaction in Government Allopathic Health facilities in the Lucknow district, UP. Key findings were: 42 percent of patients faced accessibility difficulties, 62 percent patients at tertiary facilities waited more than 30 minutes, 64.6 percent patients were dissatisfied with OPD duration and 46.6 percent of patients were dissatisfied with signboard presence.
Chattopadhyay et al (2010) used timemotion analysis to optimise immunisation clinic efficiency, highlighting opportunities to streamline vaccination and advice processes. Findings were - Median time: 120 seconds for initial registration and nutrition/health education, Vaccination/post-vaccination advice table accounted for 46.3 percent of overall time. Peak times were Vaccination/advice (Monday): 538.1 seconds and Nutrition/health assessment: 217.1 seconds. Rohit et al (2011) conducted a cross-sectional study at NSCB Medical College Hospital, Jabalpur (Madhya Pradesh) to assess patient load, OPD registration, and patient satisfaction. Findings (n= 605): (1) Average arrival rate: 80 patients/hour, (2) Waiting time - Registration queue: 29 ± 2.9 minutes and total OPD service time: 74.6 ± 4.1 minutes, (3) Patient satisfaction- Dissatisfied with physical facilities but satisfied with staff.
Methodology
This quantitative study employed a descriptive survey research design. The study was conducted in the Paediatric and General Medicine Outpatient Departments of All India Institute of Medical Sciences, Patna.
Population and sampling:
The target population comprised patients visiting the Paediatrics and General Medicine OPDs. A non-probability convenience sampling technique was used.
Sample size:
A priori sample size calculation indicated that 82 patients would provide a 9 percent confidence interval (CI) with a ±5-minute margin of error. To enhance statistical power, the sample size was expanded to 120 patients.
Inclusion criteria:
Patients presenting to General Medicine and Paediatric OPDs and patients who visit these OPDs for the first time.
Exclusion criteria:
Patients attending OPDs other than General Medicine and Paediatrics; patients declining participation in the study; emergency or critical care cases; and follow-up or repeat visit cases.
Data Collection Tool
This study utilised three research instruments: Tool 1: Social demographic variables: Age, sex, marital status, income, type of family, etc. Tool 2: Time recording- At the entry gate, registration counter, stamp counter, pre-consultation room (Vital monitoring & weight measuring) and Consultation. Tool 3: Patient satisfaction scale - Likert scale.
Validity of tool:
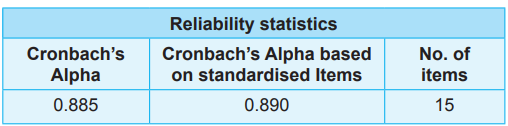
Content validity of the instruments was assessed through expert reviews (n=8), resulting in a mean content validity index (CVI) of 0.95, indicating excellent content validity (Table 1:)
Table 1: Reliability of the tool
Ethical approval:
Ethical clearance for the study was received from (1) Institutional Ethics Committee (IEC), and (2) Data Research Committee (DRC) of AIIMS Patna.
Data analysis: The data was analysed using a combination of descriptive and inferential statistical methods. The entire procedure of data collection has been shown in Fig 1.
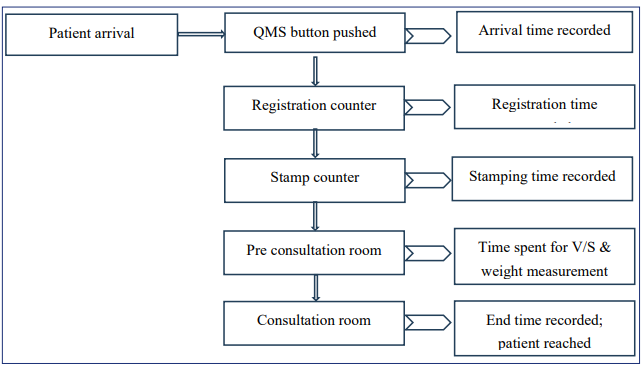
Fig 1: Data collection procedure.
Results
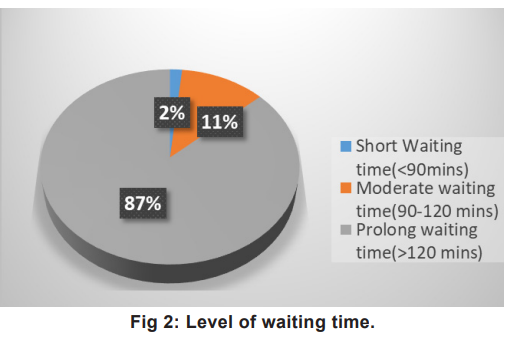
The graphical representation of the level of waiting time in minutes is shown in Fig 2. The description of waiting time with average time mean, standard deviation and percentage achievement to total waiting time mean of registration counter, stamp counter, measurements and consultation room is outlined in Table 2. Table 3 depicts the association between waiting time and socio-demographic variables at the significance level 0.05.
Patient Experience Assessment Scale
It consisted of two parts. Part 1 - Registration
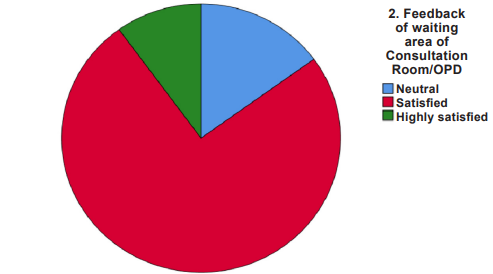
Fig 3: Satisfaction level of waiting time in waiting area of OPD and Regn area. area of consultation room/OPD Fig 3: Satisfaction level of waiting time in waitin
Table 2: Waiting time at different points, mean, SD and percentage achievement

Table 3: Association between the selected demographic variables and waiting time (N=120)

Table 4: Correlation between waiting time and patients’ satisfaction level (N=120)
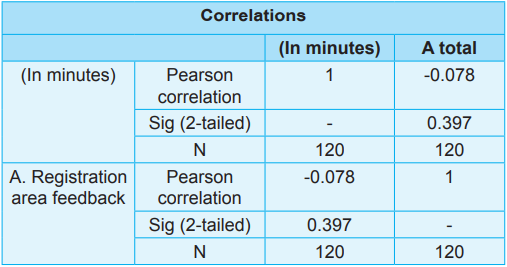
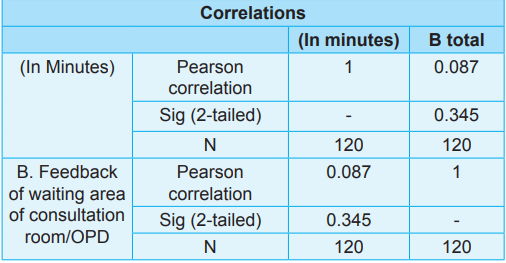
Area Feedback; and Part 2 - Feedback of waiting area of consultation room/OPD. The associations of the selected demographic variables with waiting time and correlation between waiting time and patients’ satisfaction level is depicted in Table 3 and Table 4 respectively. The results indicate that there was no significant negative correlation between waiting time and patient satisfaction suggesting that prolonged waiting times did not inevitably lead to decreased satisfaction.
Discussion
In our study, the mean waiting time for patients was 215.67 minutes, with a standard deviation of 85.076. Similar results were found by Aswar et al (2014) in their study conducted in Nanded, Maharashtra (India) who reported patients’ waiting time as 75.5 minutes on average for OPD services, and 65.3 percent satisfaction. In this study, there was a significant correlation between patient residency and waiting time, with a p-value of less than 0.05. The patient satisfaction distribution regarding OPD services was: Highly satisfied 8 percent, Satisfied 75 percent, Neutral 17 percent. Our study found no significant association between waiting time and patient satisfaction levels, as evidenced by a nonsignificant correlation coefficient. Whereas, Oche & Adamu (2013) observed that 61 percent endured 90 to 180 minutes wait, impacting satisfaction due to high patient-staff ratios.
Similarly, in the study conducted at tertiary care teaching hospital by Thapa et al (2018), the waiting times averaged 44.85 minutes, varying across departments, underscoring the need for equitable access and patient satisfaction.
Recommendations
1. By streamlining registration processes through digitalisation such as self-service Tablets or self-service kiosks, mobile applications and biometric registration can enhance operational efficiency.
2. Implementing a robust appointment scheduling system can significantly reduce wait times by optimising resource allocation, streamlining patient flow, and minimising no-shows.
3. Optimising OPD layout and signage enhances patient navigation. It involves creating a logical and intuitive layout with clear pathways, visibility, and accessibility.
4. Analysing patient volume and demand patterns to identify peak periods, typically mornings and afternoons, and increased staffing.
5. Implementing a patient tracking system enables real-time monitoring of patient transit times, optimising workflow and reducing wait times.
Limitation
Ours was a single-centre study focusing on General Medicine and Paediatric OPDs, which excluded emergency cases. Hence, prolonged waiting factors could not be investigated. This could create potential self-selection bias. Further, observational scope (entry gate to consultation room was limited.
Nursing Implications
Nursing Practice
1. Streamlined triage processes to prioritize urgent cases.
2. Enhanced patient assessment and preparation for consultations.
3. Effective communication with patients and families about wait times and expectations.
4. Proactive management of patient flow to reduce congestion.
5. Collaboration with interdisciplinary teams to optimise patient care.
For Patient Care
1. Reduced wait times and improved patient satisfaction.
2. Enhanced patient safety through timely interventions.
3. Improved patient engagement and empowerment.
4. Better management of patient anxiety and stress.
5. Increased patient compliance with treatment plans.
For Nursing Education
1. Training on patient flow management and triage.
2. Education on effective communication strategies.
3. Emphasis on patient-centred care and empathy.
4. Incorporating technology (e.g., patient tracking systems) into nursing practice.
5. Continuing education on quality improvement and patient safety
For Nursing Research
1. Investigating the impact of patient transit times on health outcomes.
2. Examining the effectiveness of interventions to reduce wait times.
3. Analysing patient satisfaction and experience.
4. Exploring the role of technology in improving patient flow.
5. Identifying best practices for patient flow management.
For Nursing Administration
1. Fostering a patient-centred culture.
2. Allocating resources effectively.
3. Developing and implementing policies.
4. Empowering nurses to take ownership of patient flow management.
For Nursing Policy
1. Developing guidelines for patient flow management.
2. Establishing standards for wait times and patient satisfaction.
3. Encouraging interdisciplinary collaboration.
4. Monitoring and evaluating the effectiveness of patient flow policies.
Conclusion
This investigative study uncovered a counterintuitive relationship between waiting times and patient satisfaction. Despite substantial waiting times, patients primarily expressed satisfaction with services. Moreover, the analysis revealed a weak correlation between waiting time and patient satisfaction, suggesting that additional factors significantly impact patient experience. The study’s findings emphasise the need for healthcare providers to optimise the quality of care and address waiting time disparities, thereby ensuring patient satisfaction persists despite prolonged wait times.
1. Langstieh AJ, Sarkar C, Wahlang JB, Marak ACC, Synmon B, Jaba I. International Journal of Science and Technology Research Archive 2022; 3 (2): 82–88
2. Joshi DC, Saini RS, Samant S, Bijlwan S. Estimation of waiting time and consultation duration for patients in the outpatient department of Radiation Oncology at a tertiary care teaching hospital in Uttarakhand, India: A cross-sectional study. Journal of Clinical and Diagnostic Research 2023 Aug; 17(8): 5-10
3. Saxena Rajeev, Sharma Sartaj, Sharda Vivek, G Nalini, Yadav Manoj Kumar. The Journal of Community Health Management 28 Dec 2020; 7 (4): 125 -27
4. Aswar NR, Kale KM, Rewatkar MP. Patients’ waiting time and their satisfaction of health care services provided at outpatient department of Government Medical College, Nanded (Maharashtra, India). Int J Health Sci Res 2014; 4(4): 21-27
5. Oche M, Adamu H. Determinants of patient waiting time in the general outpatient department of a tertiary health institution in north Western Nigeria. Ann Med Health Sci Res 2013 Oct; 3(4): 588-92. doi: 10.4103/2141- 9248.122123. PMID: 24380014; PMCID: PMC3868129
6. Thapa R, Saldanha S, Bucker N, Rishith P. An assessment of patient waiting and consultation time in the outpatient department at a selected tertiary care teaching hospital. J Evolution Med Dent Sci 2018; 7 (8): 984-88
7. Naaz F, Mohammed I. A time motion study to evaluate the average waiting time in OPD with reference to patient satisfaction in the setting of state-level AYUSH Hospital (India). Medical Journal of Islamic World Academy of Sciences 2019; 27(3):71-76
8. Kiran Kumar MV, Pillai Jawahar SK. A study on out patient satisfaction at a super specialty hospital in India. Internet Journal Medical Update 2007; 2(2): 13-17
9. Chattopadhyay A, Ghosh R, Maji S, Ray TG, Lahiri SK. A time motion study in the immunization clinic of a tertiary care hospital of Kolkata, West Bengal. Indian J Community Med 2012; 37(1): 30-33
10. Javed D. A time-motion study of OPD services at a state level Ayurvedic hospital to reduce the OPD congestion. IAMJ 2015; 3 (10): 1-9
11. Shukla Y, Tiwari R, Rohit BK, Kasar PK. An assessment of OPD registration counters services and channelization of patients in NSCB Medical College Hospital, Jabalpur (MP). Int J Med Sci Public Health 2015; 4(10): 1468-72
12. Patavegar B, Shelke S, Adhav P, Manjunath KS. A crosssectional study of patient’s satisfaction towards services received at tertiary care hospital on OPD basis. National J Community Med 2012; 3: 232-37
13. Adamu H, Oche, M. Determinants of patient waiting time in the general outpatient department of a tertiary health institution in North Western Nigeria. Annals of Medical and Health Sciences Research 2013; 3(4): 588-92
14. Khan H, Singh Kumar A. A study on waiting time of the OPD patient in a multispecialty hospital. International Journal for Research in Applied Science and Engineering Technology 2021; 9(12): 1343-46
15. Boyer L, Francois P, Doutre E, Weil G, Labarere J. Perception and use of the results of patient satisfaction surveys by care providers in a French teaching hospital. Int J Qual Health Care 2006; 18(5): 359-64
This work is licensed under a Creative Commons Attribution-NonCommercial-ShareAlike 4.0 International License.